The people behind the maps
Maps are an efficient, easy to interpret means of communicating complex data. The ERCC’s mapping team supports the UCPM by producing comprehensive, engaging and up to date maps on evolving emergency situations.
Maps are an efficient, easy to interpret means of communicating complex data. The ERCC’s mapping team supports the UCPM by producing comprehensive, engaging and up to date maps on evolving emergency situations.

As a coordination platform, the Emergency Response Coordination Centre (ERCC) requires a strong evidence and knowledge base in order to provide timely, relevant and reliable information to its main stakeholders. The ERCC’s Situational Awareness Sector supports the Union Civil Protection Mechanism (UCPM) by providing comprehensive situational assessments, operational recommendations, and scientific advice based on real-time information and mapping.
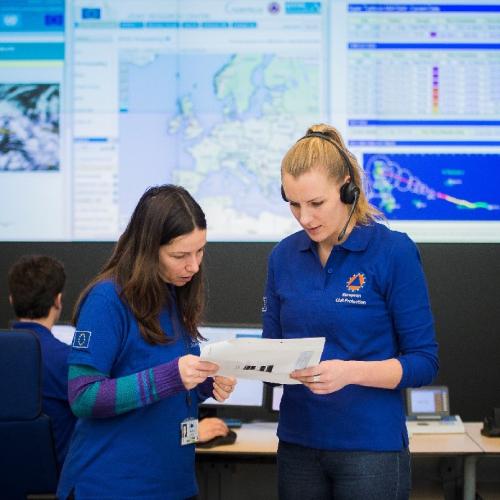
“A map is worth more than a thousand words,” says Nelles Scholiers, one of the four mappers of the ERCC’s Situational Awareness Sector. “It is a very efficient instrument to show complicated scientific information in an easy-to-understand way. […] During an emergency, decisions need to be made in a very short time. Maps can give an overview of a situation in the blink of an eye, allowing decision makers to act quickly.”
For Nelles and the rest of the mapping team - Helen Claire Curtis, Rachel Abela and Maxine Jonckheere - each working day starts with the ERCC morning briefing, where that day’s ECHO daily map is presented.
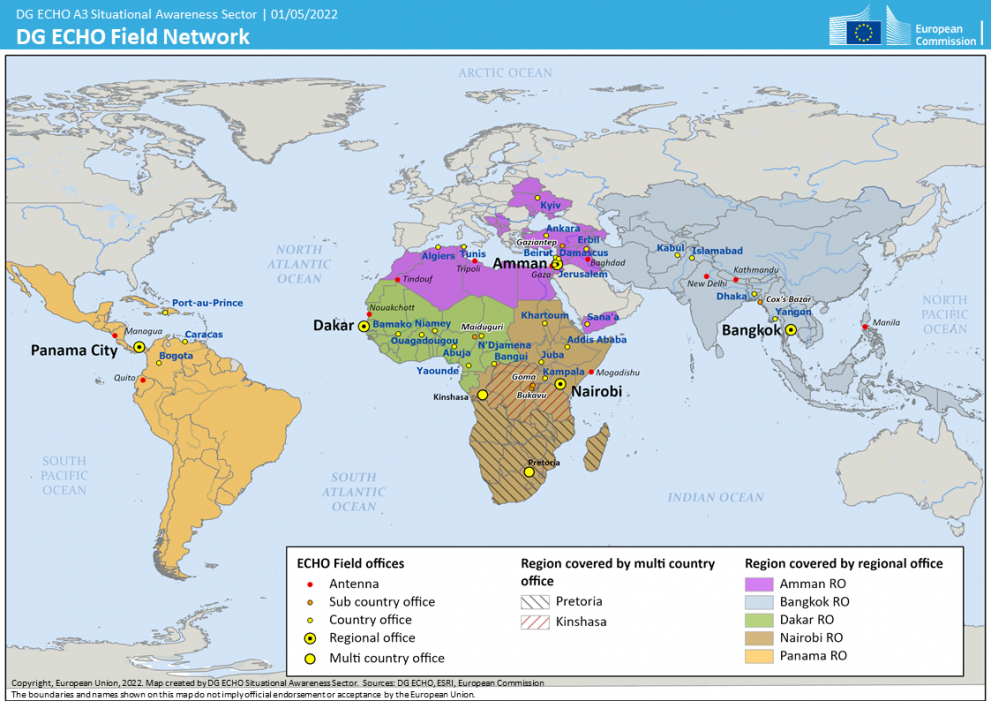
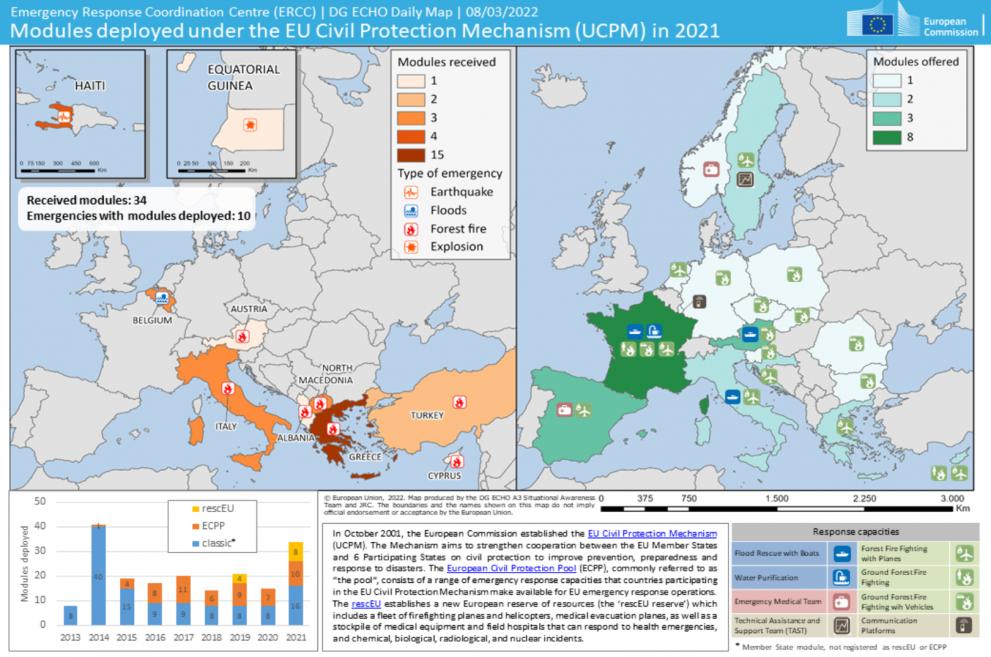
The daily map is the responsibility of the mapping team, who work closely with the Joint Research Centre (JRC) to produce and publish it each working day. It is a publicly available, ‘at a glance’ overview and analysis of a situation (e.g. an emergency relevant to civil protection or a humanitarian crisis).
In making engaging and easy to interpret maps, the team has to strike a delicate balance between data management, statistics and scientific rigour, and eye-catching aesthetics and clear communication. Often, daily maps require a lot of preparatory work to establish:
The team can only begin to use their specialised cartographic software (ArcGIS) after all the relevant data has been collected and these issues have been clarified.
The mapping team’s database of geographical data has been built up since the ERCC started producing maps about ten years ago. It covers countries, rivers, and population density, among many others. This base data is layered with other data so that it can be attributed meaning (for example, the countries layer can be given a different colour based on the number of times that a country has requested assistance from the UCPM).
When all the relevant data has been transferred into a map, the team works on the layout, adding labels (name of country, number of requests, etc.), captions and a title.
The mapping team are also consulted for internal developments where cartographic representations and analysis bring added value. They work alongside colleagues to improve the quality of their maps and the efficiency of their delivery, through novel technologies and automation, testing ideas and developing test use-cases.
“Overall, our work goes in cycles, peaking at the onset of emergencies and sometimes slowing down,” says Nelles. “This gives us time to understand how to better prepare for the next wave of activity – for sure, a day at the office is never typical.”
Supporting the ERCC means that the mapping team have formed strong working relationships with other organisations like international non-governmental organisations and national scientific institutions, sharing insights and information related to specific emergencies, as well as effective working methods.
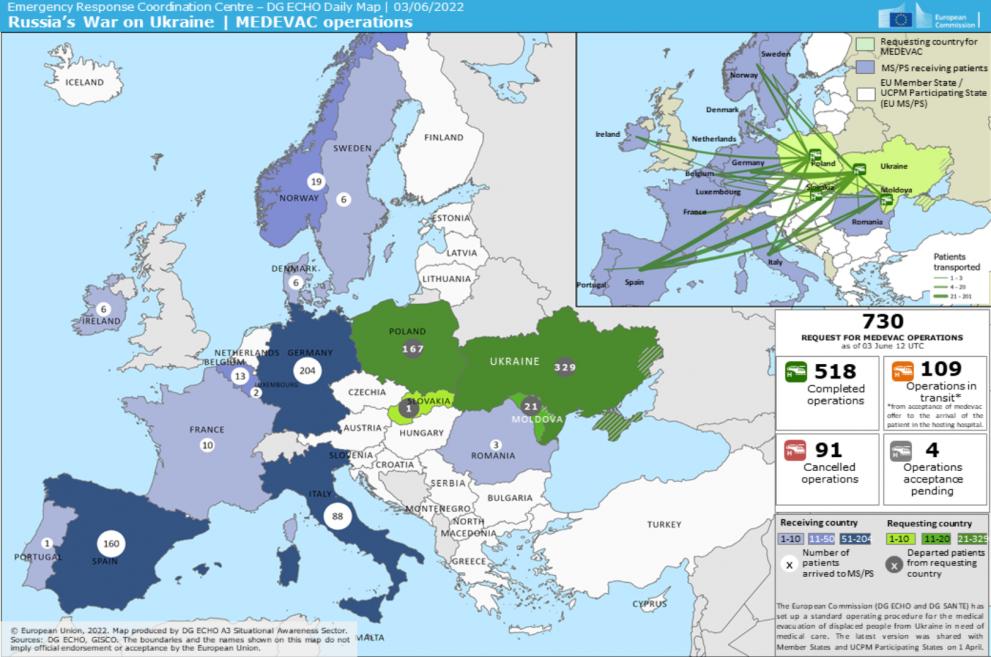
The ongoing war in Ukraine has been the main focus of the maps in recent months. Some maps are used to inform the general population about the response of the EU to the crisis, while others are used in internal coordination meetings to illustrate where ECHO operates in Ukraine and neighbouring countries. Having the war presented in a map makes it easier to follow and understand the situation as it develops, as well as to organise logistics and make decisions.
Reflecting on the challenging nature of the work, Nelles singles out the contribution made by everyone in the team.
“The most challenging part of our work follows in the direct aftermath of an emergency, when data on the emergency is most needed, but often not yet available,” he says. “In a very short time span, we need to find useful information and present it on a map in a clear and structured way, so that it is easy to interpret, but still gives a full overview of the emergency. […] But the environment after an emergency, where all colleagues are fully motivated to do their part to send assistance for the people in need – that is what makes it so special.”
The data collection and compilation work requires the cooperation of many actors. It involves a strong network including the JRC, ARISTOTLE, the Copernicus emergency satellite mapping service, ECHO colleagues from the field, contacts with data organisations and desk research from online platform and social trusted social media sources.
Looking to the future, the team hope that further digital and technological capacities will help the maps they create reach their full interactive potential.
“Maps are so much more than just an image. It is an outermost useful tool that helps you to analyse complex situations,” Nelles says. “Shifting our software more and more to an online environment, makes it possible to share our maps in a dynamic format. People can decide for their own what they want to see displayed on the map, where to zoom, and what data to filter.”
You want to see a particular topic better covered? A comment on the presentation or other special needs you want to see included in the daily map?
In the second part of 2022, a survey will be rolled out to hear your opinion! Do not hesitate to contact us if you want to take part in the daily map production by participating actively in the survey.
The Knowledge Network editorial team is here to share the news and stories of the Knowledge Network community. We'd love to hear your news, events and personal stories about your life in civil protection and disaster risk management. If you've got a story to share, please contact us.