📹 VIDEO - OVERWATCH - Web Dashboard Overview 🔴
FloodWildfires
The OVERWATCH Web Dashboard provides an intuitive web tool for emergency management personnel to establish and maintain situation awareness during crisis events.
To get access to the website, you log in by completing the Identity and Access Management platform's login form via Single Sign-On. This takes you directly to the landing page, which consists of a full-screen map and an interactive panel on the left side. The user journey begins with the creation of a new Situation Awareness instance, where operators define the geographical scope of interest by drawing a polygon directly on the interactive map interface.
This precise area delineation is complemented by metadata entry, including a descriptive name for the situation, selection of the event typology (with specialized options for wildfire or flooding scenarios), and a brief contextual description that provides background information for all stakeholders accessing the dashboard.
Once the Situation Awareness parameters are established, users proceed to the service request phase, where they can leverage various Earth Observation analytical capabilities. The interface guides operators through selecting specific service types tailored to the event category, such as burn scar analysis for wildfires or water extent mapping for floods, while also defining the temporal window of interest to constrain the analysis to relevant time periods before and after the event.
Service request catalog:
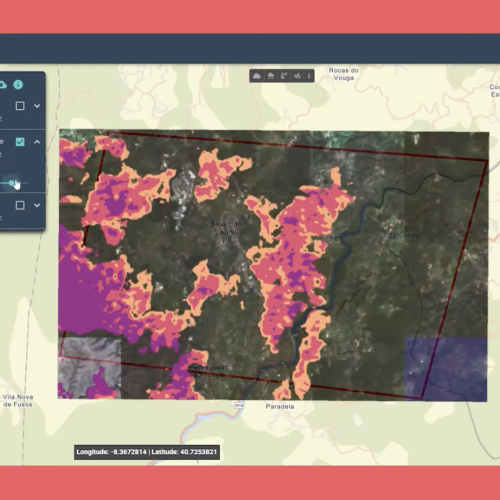
As services complete their analysis, the resulting data becomes available as WMS layers that are automatically registered with the dashboard's mapping component. The flexible layer management interface enables sophisticated visualization capabilities, allowing users to overlay multiple analytical products on the same map view with adjustable opacity controls, facilitating comparative analysis between different data products or temporal snapshots.
This visualization flexibility proves invaluable when examining how an event has evolved over time or when comparing the outputs of different analytical approaches. A key feature supporting situational awareness is the weather information panel for the displayed area.
It provides data on wind, temperature, cloud cover percentage, precipitation probability, and humidity, along with forecast values for these parameters over the next 7 days. Supporting the charts and numerical values, there's also a graphical component on the map through various layers. These are accessible via the tool positioned at the top-centre of the map, which allows users to activate or deactivate weather graphic layers displaying information such as cloud cover, rain, temperature, wind, and atmospheric pressure.
OVERWATCH project is perfectly aligned with the Union Civil Protection Knowledge Network motto – applied knowledge for action.