Mapping wildfire risk in Greece's tourist hotspots
Authors: George Eftychidis, Vassiliki Varela, Ioannis Gitas, Michalis Sismanis and Vassiliki Kounnou — Forest Management and Remote Sensing Lab (AUTH)

Authors: George Eftychidis, Vassiliki Varela, Ioannis Gitas, Michalis Sismanis and Vassiliki Kounnou — Forest Management and Remote Sensing Lab (AUTH)
How FIRE-SCENE turns satellite data into street-level wildfire-risk maps for Eastern Attica and Rhodes — and works with local authorities to turn those maps into evacuation planning.
Wildfires in the Mediterranean no longer behave the way emergency plans assume. The 2018 Mati fire in Eastern Attica killed 102 people — the deadliest wildfire ever recorded in Europe — and in July 2023 a fire in southern Rhodes forced roughly 19,000 people to leave in the largest evacuation in Greek history. Both draw summer crowds that dwarf the permanent population. Within the EU-funded FIRE-SCENE project, AUTH leads Pilot 2, focused on these two places. This article summarises what the Greek pilot has produced so far: a way to map wildfire risk almost street by street, and — working with a local authority — a way to turn those maps into evacuation decisions.
At a glance
› 2018 Mati (Eastern Attica): 102 fatalities and more than 2,500 houses lost — the deadliest wildfire in European history.
› 2023 Lardos–Lahania (Rhodes): about 17,600 hectares burned and roughly 19,000 people evacuated — the largest evacuation ever in Greece.
› Risk mapped at 20-metre resolution, then aggregated to 1 × 1 km cells that municipalities can plan around.
› Attica: average risk 2.65 (over 70% of cells “High”). Rhodes: average only 1.734, yet half of all cells hide an extreme-risk pixel.
› Evacuation readiness assessed for the 10 settlements of the Municipality of Rafina–Pikermi, linked to its “IOLAOS 2” plan.
At the center of the work is the Urbanization Classification Scheme (UCS) — a way to combine many layers of geographic information into a single picture of where fire risk is concentrated. It follows the risk equation used by the United Nations: Risk = Hazard × f(Exposure, Vulnerability) — how likely and intense a fire is, how many people, buildings, and roads it would reach, and how easily they would be harmed. Satellite imagery, terrain and fuel data, infrastructure records, and fire-weather simulations are processed in a GIS at 20-meter resolution and merged into a single Fire Risk Index (FRI), weighted 40% hazard, 30% exposure, and 30% vulnerability. The result is then aggregated onto a 1 × 1 km grid of cells that municipalities can plan around.
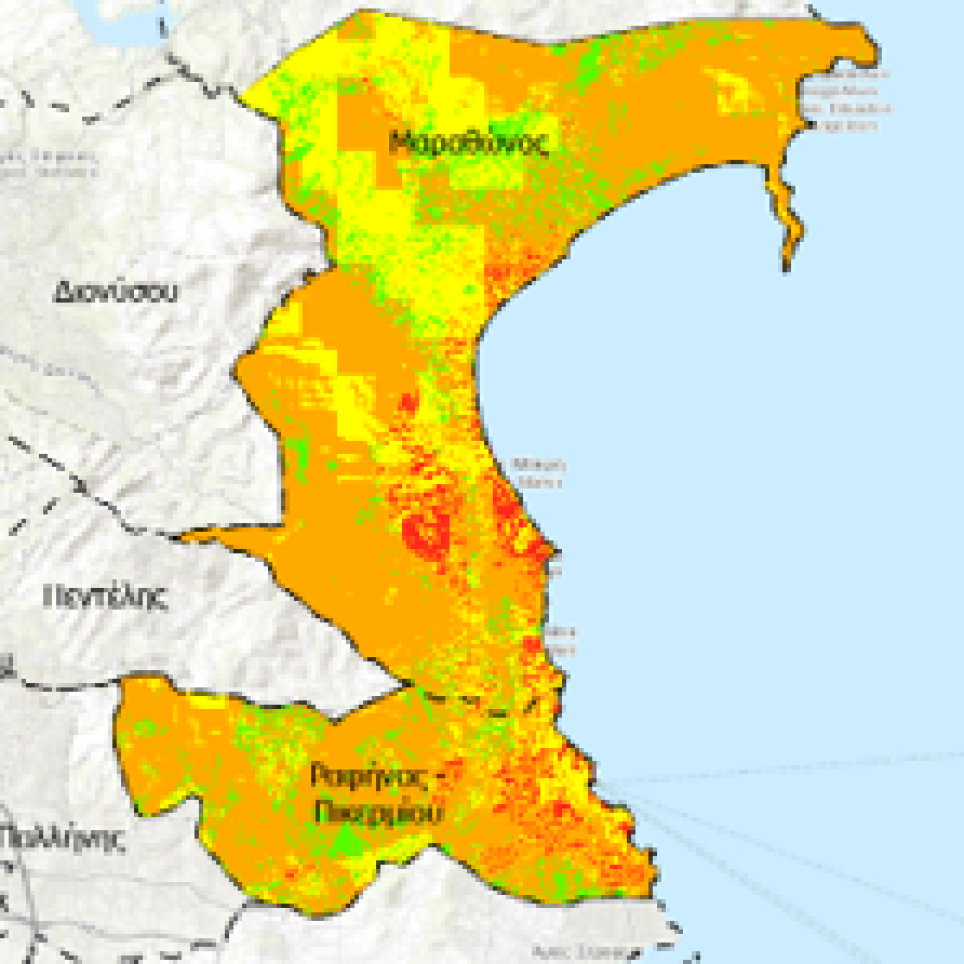
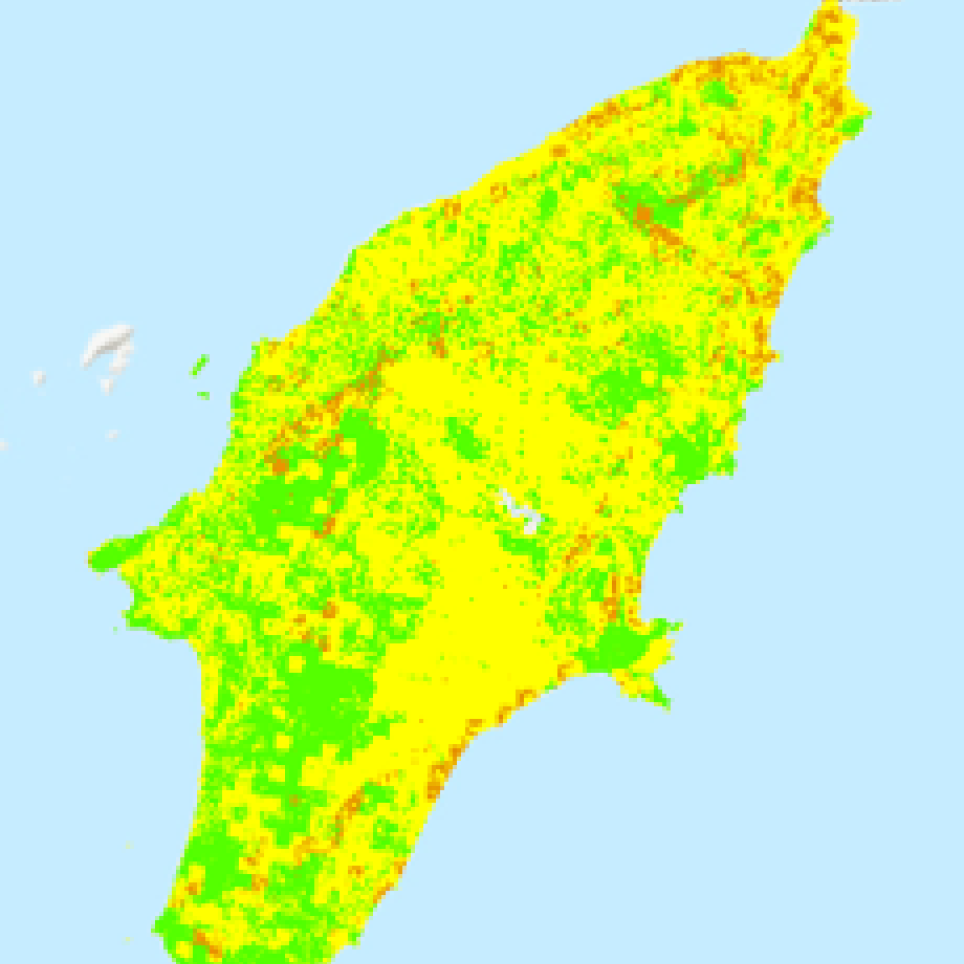
Figure 1. Fire Risk Index (FRI) maps for the two Greek pilot areas — Eastern Attica, including the Municipality of Rafina–Pikermi (left), and the island of Rhodes (right) — at 20-metre resolution. Red marks Very-High risk concentrated in the wildland–urban interface; note the high-risk pixels hidden within otherwise “Medium” areas on Rhodes. FIRE-SCENE / AUTH, March 2026.
The two pilots show contrasting profiles. Eastern Attica — Marathon, Nea Makri, Rafina–Pikermi, Spata–Artemida, Pallini, Penteli, and Dionyssos — comes out uniformly dangerous: more than 70% of 1 km cells are High, and none is Low. Every cell contains at least one 20-meter pixel of extreme risk, and over a third contain pixels where ground firefighting would be impractical. These hotspots line up with the wildland–urban interface along Marathon, Rafina and Penteli — the zones devastated in 2018.
Rhodes tells a subtler story. Its island-wide average is lower (1.734) and most cells look only “Medium”, but a maximum-value analysis exposes a hidden pattern: almost half the cells (49.8%) contain at least one extreme-risk pixel, and about a third are “hidden hotspots” whose calm average conceals a dangerous core. The driver is tourism — roughly 400 hotels, more than 100,000 beds and some 3 million visitors a year on top of about 115,000 residents. Peak occupancy in July and August coincides with peak fire weather, when the northerly Meltemi wind pushes fire south toward the coastal resorts.
Both maps were checked against real fires. In Attica, the Very-High cells match the footprint of the 2018 Mati disaster; in Rhodes, the 2023 Lardos–Lahania fire ran through cells the UCS independently classifies as High to Very High — an after-the-fact agreement that gives confidence the maps reflect reality, not a theoretical abstraction.
The maps matter only if they change what people should do. The pilot links each FRI class to a preparedness tier — from routine monitoring to permanent pre-positioning of forces — and aims to sharpen the geographic targeting of the 112/GR-Alert cell-broadcast alerts. Deliverable D3.4 packages this into a Tourism Toolkit: evacuation guidelines, training for municipal staff and hotel operators, and a WRSET/WASET calculator to estimate whether a settlement can be evacuated before the fire arrives.
From the map to the street: working with Rafina–Pikermi
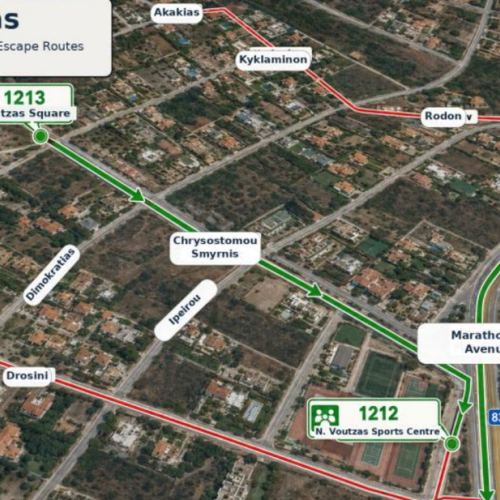
A risk map earns its keep when a local authority can act on it. In May 2026, the pilot team visited the town hall of Rafina–Pikermi — one of the municipalities scarred in 2018 — and began a working exchange with its civil-protection service. The municipality provided the maps used to inform residents under its organized evacuation plan, “IOLAOS 2,” which details assembly points and escape routes for each settlement. However, staff pointed out that these maps were not included. FIRE-SCENE aimed to address this gap.
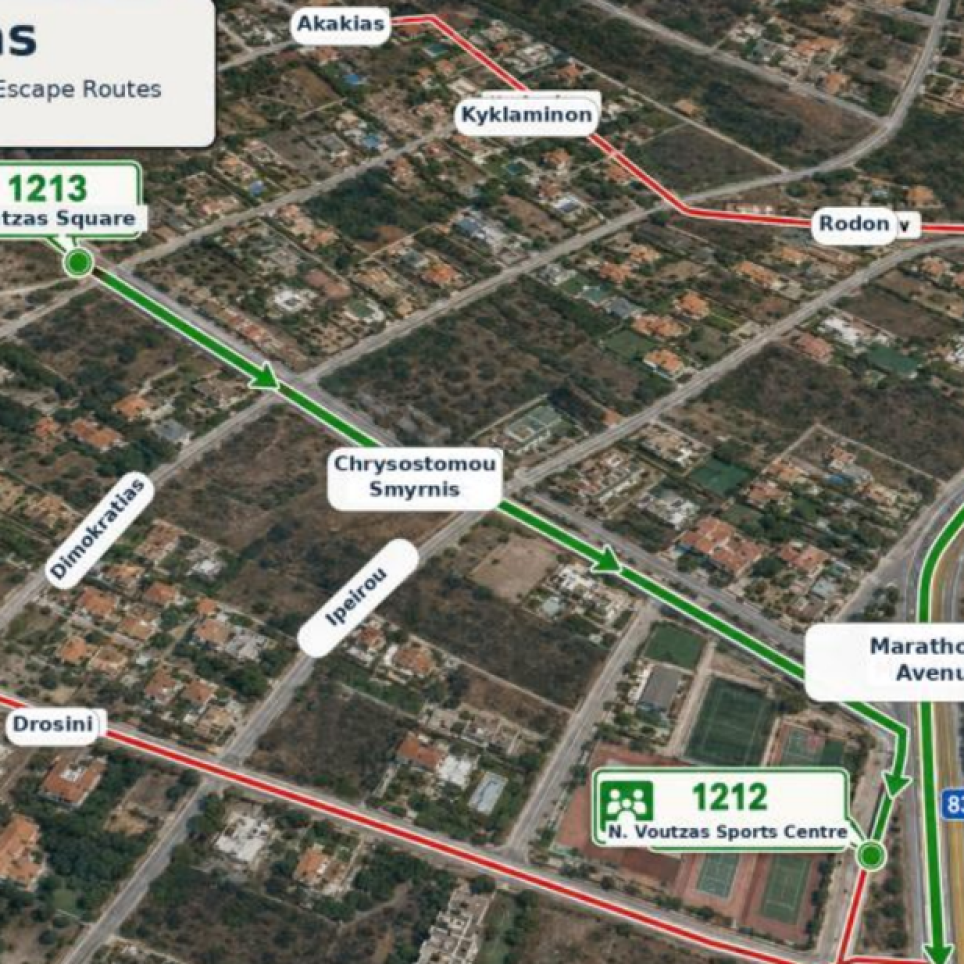
Figure 2. Assembly points and escape routes for Neos Voutzas, a Rafina–Pikermi settlement in the “IOLAOS 2” plan — produced by FIRE-SCENE to accompany the plan’s text (green: main routes; red: secondary; markers: assembly points). FIRE-SCENE / AUTH with the Municipality of Rafina–Pikermi, June 2026 (labels in Greek).
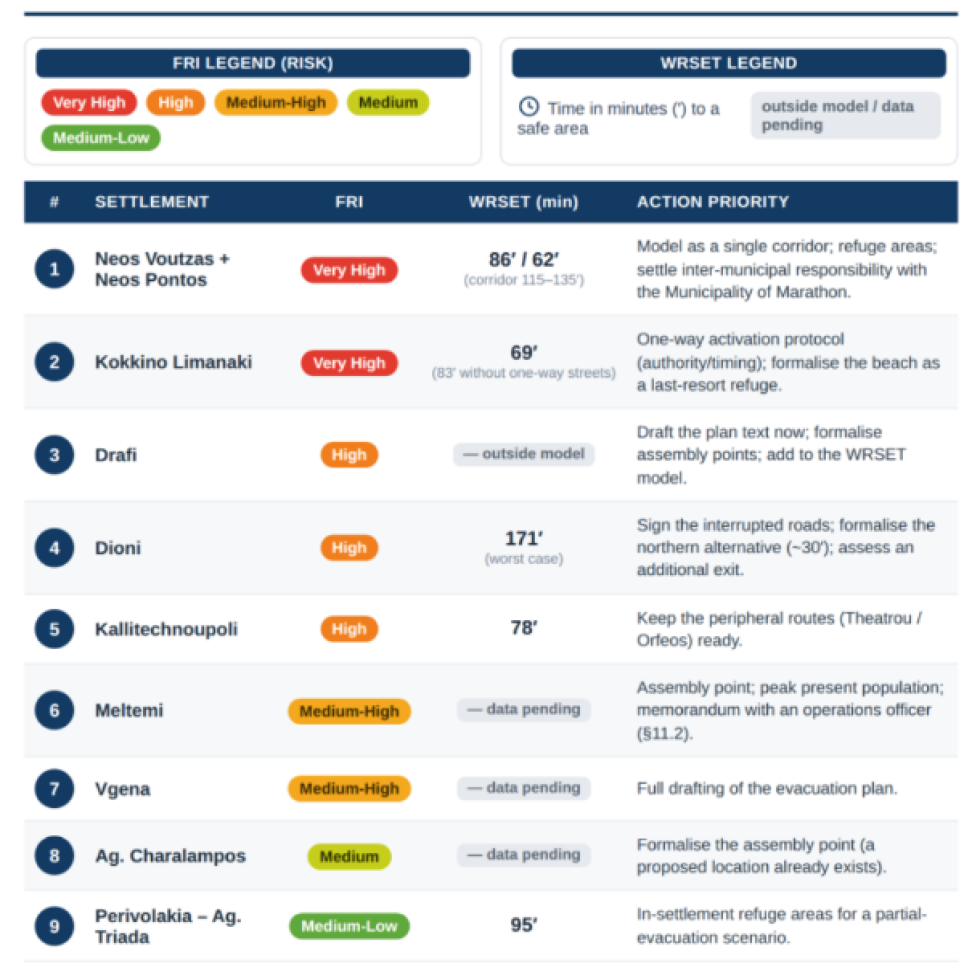
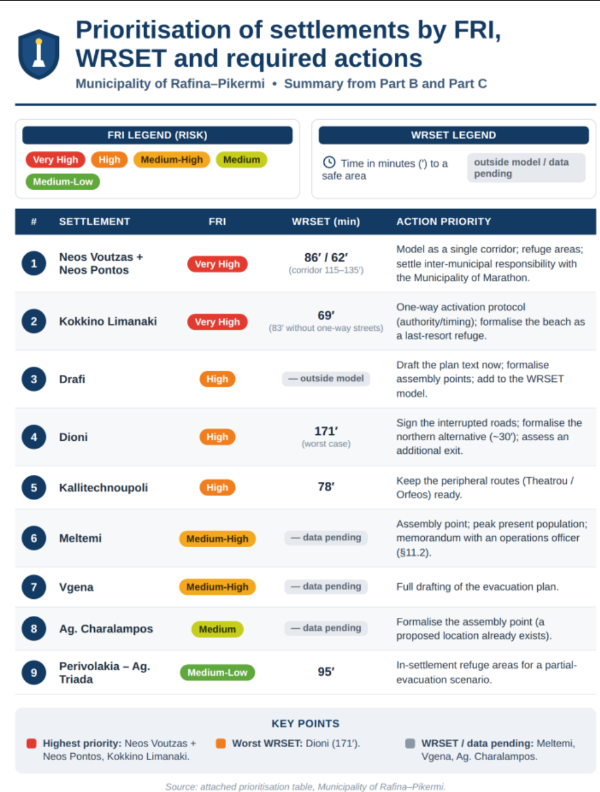
AUTH combined the IOLAOS 2 material with the project’s UCS/FRI analysis to test, settlement by settlement, whether the WRSET/WASET method could be applied — whether there is enough data to compare the time a settlement needs to evacuate (WRSET) with the time available before the fire arrives (WASET). Six of the ten settlements held enough detail for a first estimate, three needed additions and one lacked the basics. For the six, first-order estimates ranged from about an hour for small settlements with adequate exits, up to roughly 170 minutes for Dioni, the most demanding case.
The analysis also flagged a shared risk! Neos Voutzas, Neos Pontos, and Kokkino Limanaki all drain onto the same axis — Marathonos Avenue — so they must bmodellede modeled as a single evacuation corridor rather than independently. The results were delivered as a report and an interactive web page, and forwarded to the municipality’s leadership and civil-protection staff. The exchange clarified an existing distinction in the plan: settlements bordered by forest may sometimes have residents use in-settlement refuges (partial evacuation), while those located within the forest are considered very high risk and need immediate, full evacuation.
Figure 3. Prioritisation of the ten Rafina–Pikermi settlements by Fire Risk Index, estimated evacuation time (WRSET) and required action. FIRE-SCENE / AUTH with the Municipality of Rafina–Pikermi, June 2026 (in Greek).
Conclusion
The Greek pilot shows that wildfire risk in tourist areas can be measured, mapped, and acted upon using existing data. Eastern Attica and Rhodes now have evidence-based risk maps validated against their own recent disasters; in Rafina–Pikermi, those maps are already being folded into a real municipal evacuation plan. The methods are deliberately transferable, and any Mediterranean municipality with comparable data could repeat them. The next step has already begun — putting the tools into the hands of the authorities, civil protection services, and tourism operators who will consider them in the next fire seasons.